
Most dental practice buyers spend their first meetings asking about collections and patient counts. Both matter. But neither one tells the full story of whether a practice is financially healthy, efficiently run, or genuinely worth the asking price.
That story lives in the Profit and Loss statement.
The dental practice P&L (also called an income statement) is the document that separates a practice that looks good from one that actually performs. It shows where money comes in, where it goes, and most importantly, how much of it a new owner can actually keep. Read it correctly, and you’ll know whether a practice is a strong investment, a turnaround opportunity, or a financial trap dressed up in a nice office.
This guide walks you through every line, every benchmark, and every red flag so that you can read any dental practice P&L with the same confidence as a dental CPA.
What a Dental Practice P&L Statement Actually Shows
A Profit and Loss statement summarizes all of a business’s income and expenses over a defined period, typically monthly or annually. For a dental practice, it answers four fundamental questions:
- How much did the practice collect?
- What did it cost to operate?
- What did the owner take home?
- How much would a new owner realistically earn?
That last question is where most buyers get tripped up. The net income on a dental practice P&L is rarely the same as what the new owner will earn, because most practice owners run a combination of business expenses and personal expenses through the same document. Understanding how to separate them is the skill that separates a confident buyer from one who overpays or walks away from a strong deal.
According to the Oregon Small Business Development Center’s guidance on reading P&L statements, the primary purpose of an income statement is to assess profitability, identify financial trends, and inform investment decisions. In a dental practice context, those three functions are exactly what a buyer needs to answer before signing anything.
The Four Core Sections of a Dental P&L
Every dental practice P&L follows the same fundamental structure. Here’s what each section contains and why it matters.
Revenue
Revenue in a dental practice P&L represents total collections: the actual cash received from patients and insurance companies after adjustments, write-offs, and PPO fee reductions. This is not the same as production (what was billed), and it is not the same as gross billings.
Collections is the number that all expense benchmarks are calculated against. Every percentage in a dental P&L analysis is expressed as a percentage of collections, not production. This distinction matters because a practice that produces $1.4 million but only collects $1.1 million has a collection rate problem that could erode profitability even if everything else looks healthy.
According to Northstar Financial Advisory’s dental overhead benchmark analysis, a healthy collection rate runs between 95% and 99% of production. A collection rate below 93% warrants a close look at billing processes, insurance contract terms, and patient accounts receivable aging.
Cost of Goods Sold (COGS)
In a dental practice, COGS typically includes two line items: dental supplies and lab fees. These are the direct clinical costs that scale with patient volume and case mix.
- Dental supplies should run 5% to 7% of collections. Top-performing practices often hold this below 5%, according to Percentology’s 2024 dental overhead benchmarks, which are based on data from over 100 real practices.
- Lab fees should run 7% to 10% of collections for most general practices, per the 2026 U.S. Dental Practice Benchmarks published by the Dental Accounting Organization. Practices with higher restorative or implant case volume will naturally run higher. Practices with fees below 4% may be underdiagnosing or avoiding complex cases.
Operating Expenses
This is the largest and most scrutinized section of the dental P&L. It includes every cost required to run the practice that isn’t a direct clinical supply cost. Key operating expense categories and their benchmarks are covered in detail in the next section.
Net Income
Net income is what remains after all expenses are subtracted from collections. On a dental practice P&L, however, net income is rarely the number that buyers, sellers, or lenders use to evaluate the practice. That number is Seller’s Discretionary Earnings (SDE), which is covered in detail below.
The Benchmark Table: What Healthy Numbers Look Like
Converting every expense line to a percentage of collections is the single most important habit a dental practice buyer can develop. Raw dollar figures are meaningless without context. Percentages reveal how efficiently a practice operates regardless of its size.
The following benchmarks reflect current industry data from Percentology’s 2024 dental benchmarks, the Dental Accounting Organization’s 2026 U.S. Dental Practice Benchmarks, and Northstar Financial Advisory’s overhead guidance:
| Expense Category | Healthy Target | Red Flag Threshold |
| Staff Wages (non-doctor) | 25% to 28% | Above 33% |
| Facility (Rent and Utilities) | 5% to 7% | Above 9% |
| Dental Supplies | 5% to 7% | Above 8% |
| Lab Fees | 7% to 10% | Above 12% |
| Marketing | 1% to 3% | Below 1% or above 8% with no tracking |
| General Admin and Office | 3% to 6% | Above 9% |
| Total Overhead | 55% to 65% | Above 70% |
| SDE / Net Income to Owner | 35% to 45% | Below 30% |
Staff wages consistently represent the largest single expense category in dental practices. Patient Prism’s 2026 dental profit margin benchmarks report that the average dental practice spends approximately 33.8% of collections on staff compensation, above the 30% benchmark target. Every percentage point above 30% on a $1.2 million practice represents approximately $12,000 in eroded annual profit, according to Northstar Financial Advisory.
Facility costs (rent, utilities, and maintenance) should run 5% to 7% of collections. Core Advisors’ 2026 dental overhead benchmark analysis notes that if occupancy costs exceed 7%, the root cause is often underutilized operatory space or a lease that outpaced collections growth, not necessarily an above-market rent rate.
Red Flags: What Unhealthy Numbers Signal
Not all deviations from benchmark targets signal a problem. Some signal an opportunity. The difference lies in understanding what’s driving the variance.
High staff wages (above 33% of collections) can indicate overstaffing, but they can also indicate low production per visit, poor scheduling efficiency, or a payer mix heavily weighted toward PPO plans that discount procedure fees. Before concluding, check production per provider day alongside the staffing percentage.
Rent above 8% of collections is worth scrutinizing, but context matters. A practice in a high-cost urban market with strong new patient flow and a growing patient base may sustain higher occupancy costs than a rural practice with a flat patient count. What matters is whether the space is being utilized fully. According to PorterKinney PC’s analysis of 10,000 dental practice data points from 2020 to 2024, average rent runs approximately 5.8% of revenue for general practices, with top performers holding it at 5% or below.
Unusually low supply and lab fees (below 4% each) are not automatically good news. A practice with lab fees below 4% may be avoiding restorative cases, referring out complex work that could be completed in-house, or underdiagnosing patients. This represents a missed revenue opportunity for the right buyer, but it also creates a clinical question worth exploring.
Vague or bloated “Miscellaneous” or “Other” categories are a consistent red flag. Sellers who run personal expenses through the practice (legitimately or otherwise) tend to route them into catch-all categories. Ask the seller to itemize every line above $2,000 in any generic expense category before making an offer.
A declining collection rate (below 93%) over two or more consecutive years suggests either a billing process problem or a payer mix issue. Both are solvable, but both require investment and time.
Why SDE Matters More Than Net Income
Net income on a dental practice P&L is a starting point. Seller’s Discretionary Earnings is the destination.
SDE represents the true economic benefit available to a single working owner, calculated by adding back to net income all of the personal, non-recurring, and owner-specific expenses that were run through the practice. Investopedia’s guide to Seller’s Discretionary Earnings identifies the most common and defensible add-backs as:
- Owner’s above-market W-2 salary or draws
- Owner’s personal health insurance and retirement contributions
- Depreciation and amortization
- Interest expense on existing debt
- Personal vehicle lease or use
- One-time legal or professional fees
- Family members compensated above market rate for their role
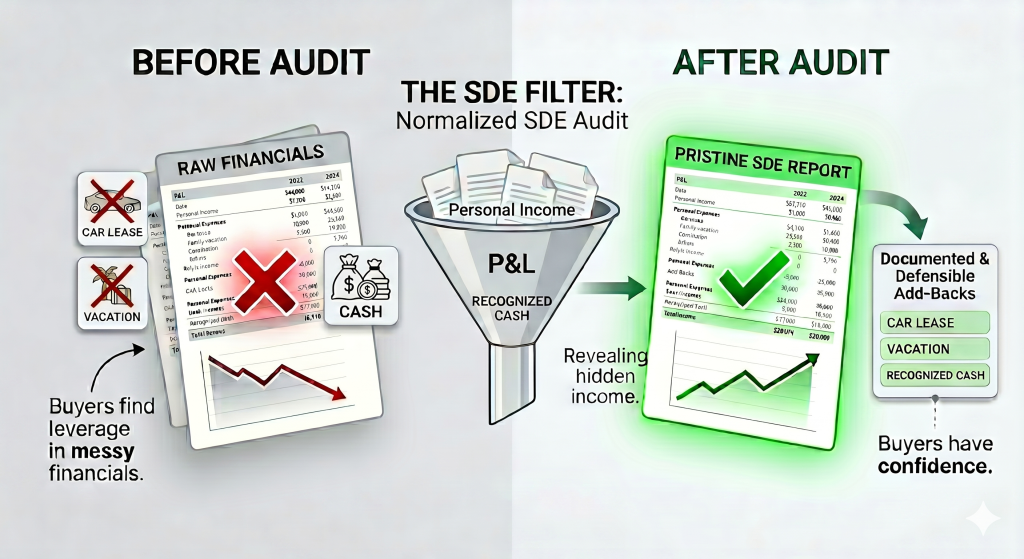
The calculation is straightforward:
SDE = Net Income + Owner Salary/Draws + Personal Add-Backs + Non-Recurring Expenses
Here is a concrete example:
| Line Item | Amount | % of Collections |
| Annual Collections | $1,000,000 | 100% |
| Reported Net Income | $225,000 | 22.5% |
| Owner salary add-back | $60,000 | |
| Personal vehicle add-back | $12,000 | |
| CE travel (personal use) | $15,000 | |
| Spouse salary add-back | $28,000 | |
| One-time legal fee | $15,000 | |
| Normalized SDE | $355,000 | 35.5% |
Without normalization, this practice appears to generate a 22.5% margin, which would concern most lenders. After normalization, it shows a 35.5% SDE margin: a bankable, fundable practice.
Every add-back must be documented and defensible. Aggressive or undocumented add-backs will be challenged during the buyer’s due diligence process and can cause a deal to re-trade or collapse entirely. If the SDE, after full normalization, sits below 30% of collections, the practice may not generate enough cash flow to service acquisition debt, pay a fair owner salary, and cover operating costs simultaneously. This is the threshold lenders watch most closely.
A Real-World P&L Walkthrough
Here is how a well-structured, lender-ready dental practice P&L looks on paper, using a $1,000,000 collection practice:
| Line Item | Amount | % of Collections | Benchmark |
| Total Collections | $1,000,000 | 100% | |
| Dental Supplies | $52,000 | 5.2% | 5% to 7% |
| Lab Fees | $48,000 | 4.8% | 7% to 10% |
| Staff Wages | $255,000 | 25.5% | 25% to 28% |
| Rent and Utilities | $62,000 | 6.2% | 5% to 7% |
| Marketing | $22,000 | 2.2% | 1% to 3% |
| Admin and Office | $34,000 | 3.4% | 3% to 6% |
| Total Overhead | $473,000 | 47.3% | 55% to 65% |
| Net Income | $527,000 | 52.7% |
In this example, the practice is performing above benchmark across the board, with overhead running below the 55% to 65% target range. This is a highly efficient practice that a lender will look at favorably. A buyer using SDE-based valuation multiples of 1.75x to 2.0x (the standard range for private practice sales, per Private Practice Research’s 2026 valuation framework) would arrive at a valuation range of approximately $920,000 to $1,050,000 before adjustments.
How Lenders Read the P&L
When a buyer submits a loan application to purchase a dental practice, the lender’s underwriting team will do exactly what this guide describes: normalize the net income to SDE, verify it against two to three years of tax returns, and confirm that the SDE can support three things simultaneously:
- Debt service on the acquisition loan
- A market-rate salary for the new owner
- Adequate operating capital for the practice
The Blue and Co. 2025 National Dental Survey, based on responses from more than 1,000 dental practices, found that top-performing practices achieved a 39% margin before debt service and capital expenditures in 2024. This is the bar lenders use as a reference point. A practice whose normalized SDE falls below 30% will typically require additional documentation, a larger down payment, or a price adjustment to get financed.
Most dental practice lenders require two to three years of complete P&L statements alongside personal and business tax returns. Inconsistencies between the P&L and the tax returns (common when personal expenses are run through the practice) are not automatically disqualifying, but they do need to be explained and documented clearly.
FAQs
What is the difference between a dental practice P&L and a tax return?
A P&L statement is an internal financial document that reflects how the practice is actually managed. A tax return reflects what is reported to the IRS, which may include additional deductions, depreciation strategies, and timing adjustments not visible on the P&L. Buyers should always review both documents together, since significant gaps between the two often contain important information about how expenses are managed.
What is a healthy net income percentage for a dental practice?
According to Percentology’s 2024 dental benchmark data, a healthy net income (before owner salary normalization) runs 35% to 40% of collections for most solo general practices. After normalization to SDE, top-performing practices achieve 40% to 45%. Practices below 30% SDE will face scrutiny from lenders and may need price adjustments to be financeable.
How many years of P&L statements should a buyer request?
Request a minimum of three full calendar years of P&L statements plus the most recent year-to-date report. Three years provide enough data to identify trends rather than anomalies, and to spot whether overhead is creeping upward or collections are declining.
What are the most common red flags in a dental practice P&L?
The most common red flags include staff wages above 33% of collections, rent above 8% to 9% of collections, a collection rate below 93% of production, vague or bloated catch-all expense categories, and a normalized SDE below 30% of annual collections. Any one of these warrants a deeper conversation. Multiple red flags together are a signal to proceed very carefully or renegotiate the price.
What is the difference between EBITDA and SDE in a dental practice valuation?
SDE adds back the working owner’s full compensation, making it the appropriate metric for single-owner practices where the buyer will be the primary clinician. EBITDA (Earnings Before Interest, Taxes, Depreciation, and Amortization) does not add back owner compensation and is more commonly used for multi-doctor practices, group practices, and DSO transactions. Most private dental practice sales, where a dentist is buying from another dentist, are valued on SDE multiples, per Private Practice Research’s 2026 valuation framework.
Should a buyer hire a dental CPA to review the P&L?
Yes. A dental-specific CPA (not a generalist) will recognize normalization opportunities, flag inconsistencies between the P&L and tax returns, and help structure the add-back schedule in a way that is defensible to lenders and buyers. This is not an optional step for any acquisition above $500,000.
Conclusion
The dental practice P&L is not just a financial document. It is the clearest possible picture of how a practice is run, what it costs, and what it can realistically provide to a new owner. Every line tells a story.
Reading it correctly means converting every expense to a percentage of collections, comparing those percentages to current industry benchmarks, identifying where the practice over- or underperforms, and normalizing net income to Seller’s Discretionary Earnings before drawing any conclusions about value.
Buyers who master this skill don’t just avoid bad deals. They identify the ones that look complicated on the surface but perform beautifully underneath. They ask better questions. They negotiate with evidence. And they walk into lender meetings with the documentation and confidence that turns approvals into closings.
When you understand the numbers, you’re not just buying a practice. You’re making an investment you can actually defend.